4.3. Experimental odd-even mass staggering (OEMS)#
In this tutorial, you will learn how to calculate the OEMS from the experimental nuclear chart (using the 3-point formula).
Import the libraries that will be employed in this tutorial.
# Import numpy
import numpy as np
# Import matplotlib
import matplotlib.pyplot as plt
# Import nucleardatapy package
import nucleardatapy as nuda
%matplotlib inline
You can simply print out the properties of the nuda’s function that we will use:
# Explore the nucleardatapy module to find the correct attribute
print(dir(nuda.nuc.setupBEExp))
['D3n', 'D3p', 'S2n', 'S2p', '__class__', '__delattr__', '__dict__', '__dir__', '__doc__', '__eq__', '__format__', '__ge__', '__getattribute__', '__getstate__', '__gt__', '__hash__', '__init__', '__init_subclass__', '__le__', '__lt__', '__module__', '__ne__', '__new__', '__reduce__', '__reduce_ex__', '__repr__', '__setattr__', '__sizeof__', '__str__', '__subclasshook__', '__weakref__', 'isotones', 'isotopes', 'print_outputs', 'select', 'select_year']
Get the full list of tables:
tables, tables_lower = nuda.nuc.be_exp_tables()
print('tables:',tables)
tables: ['AME']
Get the versions associated to this table:
versions, versions_lower = nuda.nuc.be_exp_versions(table = 'AME')
print('versions:',versions)
versions: ['2020', '2016', '2012']
Extract data from a given table and version:
mas_exp = nuda.nuc.setupBEExp( table = 'AME', version = '2020' )
print('number of nuclei:',mas_exp.nbNuc)
Oldest discovery is from:  1896
Most recent discovery is from:  2020
dist: [  20.   19.  118.  170.  253.  620.  510.  888.  632.  394.  310.  252.
   72. 1569.    0.    0.    0.    0.    0.    0.]
number of nuclei: 5827
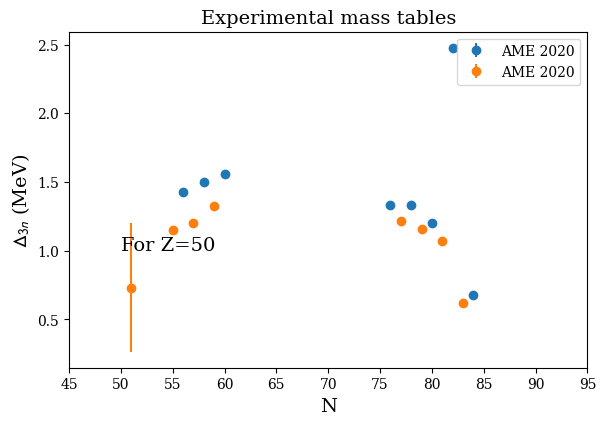
Compute the neutron EOMS:
Zref = 50
mas_exp2 = mas_exp.select( state = 'gs', interp = 'n' )
mas_exp3 = mas_exp2.isotopes( Zref = Zref )
d3n = mas_exp3.D3n( Zref = Zref )
number of nuclei(Tot): 5573
number of nuclei(Sta): 2297
number of nuclei(Sel): 2297
Nmin,Nmax: 50 85
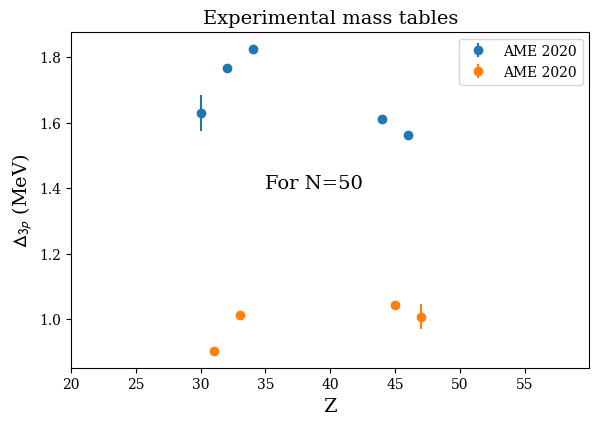
Compute the proton EOMS:
Nref = 50
mas_exp2 = mas_exp.select( state = 'gs', interp = 'n' )
mas_exp3 = mas_exp2.isotones( Nref = Nref )
d3p = mas_exp3.D3p( Nref = Nref )
number of nuclei(Tot): 5573
number of nuclei(Sta): 2297
number of nuclei(Sel): 2297
Zmin,Zmax: 29 50
print results:
print('N_even(Z=50):',d3n.D3n_N_even)
print('D3n(Z=50):',d3n.D3n_E_even)
print()
print('Z_even(N=50):',d3p.D3p_Z_even)
print('D3p(N=50):',d3p.D3p_E_even)
N_even(Z=50): [56 58 60 76 78 80 82 84]
D3n(Z=50): [1.429   1.499   1.5575  1.33315 1.3305  1.2042  2.47715 0.68105]

Z_even(N=50): [30 32 34 44 46]
D3p(N=50): [1.6296  1.76645 1.82555 1.61045 1.5605 ]
Plot nuclear chart:
nuda.fig.nuc_setupBEExp_D3n_fig( None, tables, versions, Zref = 50 )
Plot name: None
Tables: ['AME']
Zref: 50
Oldest discovery is from:  1896
Most recent discovery is from:  2020
dist: [  20.   19.  118.  170.  253.  620.  510.  888.  632.  394.  310.  252.
   72. 1569.    0.    0.    0.    0.    0.    0.]
number of nuclei(Tot): 5573
number of nuclei(Sta): 2297
number of nuclei(Sel): 2297
Nmin,Nmax: 50 85
nuda.fig.nuc_setupBEExp_D3p_fig( None, tables, versions, Nref = 50 )
Plot name: None
Tables: ['AME']
Nref: 50
Oldest discovery is from:  1896
Most recent discovery is from:  2020
dist: [  20.   19.  118.  170.  253.  620.  510.  888.  632.  394.  310.  252.
   72. 1569.    0.    0.    0.    0.    0.    0.]
number of nuclei(Tot): 5573
number of nuclei(Sta): 2297
number of nuclei(Sel): 2297
Zmin,Zmax: 29 50