5.4. Experimental hyper-nuclear chart#
In this tutorial, you will learn how to plot the experimental hyper-nuclear chart.
Import the libraries that will be employed in this tutorial.
# Import numpy
import numpy as np
# Import matplotlib
import matplotlib.pyplot as plt
# Import nucleardatapy package
import nucleardatapy as nuda
%matplotlib inline
You can simply print out the properties of the nuda’s function that we will use:
# Explore the nucleardatapy module to find the correct attribute
print(dir(nuda.hnuc.setupRE1LExp))
['__class__', '__delattr__', '__dict__', '__dir__', '__doc__', '__eq__', '__format__', '__ge__', '__getattribute__', '__getstate__', '__gt__', '__hash__', '__init__', '__init_subclass__', '__le__', '__lt__', '__module__', '__ne__', '__new__', '__reduce__', '__reduce_ex__', '__repr__', '__setattr__', '__sizeof__', '__str__', '__subclasshook__', '__weakref__', 'print_latex', 'print_outputs']
List all available experimental tables from the toolkit:
tables1L, tables1L_lower = nuda.hnuc.re1L_exp_tables()
print('tables1L:',tables1L)
tables2L, tables2L_lower = nuda.hnuc.re2L_exp_tables()
print('tables2L:',tables2L)
tables1Xi, tables1Xi_lower = nuda.hnuc.re1Xi_exp_tables()
print('tables1Xi:',tables1Xi)
tables1L: ['2016-1L-GHM']
tables2L: ['1991-2L-Yamamoto', '2013-2L-Ahn', '2019-2L-Ekawa']
tables1Xi: ['2015-1Xi-Nakazawa']
Set the experimental tables
table1L = ['2016-1L-GHM']
table2L = ['2013-2L-Ahn']
table1Xi = ['2015-1Xi-Nakazawa']
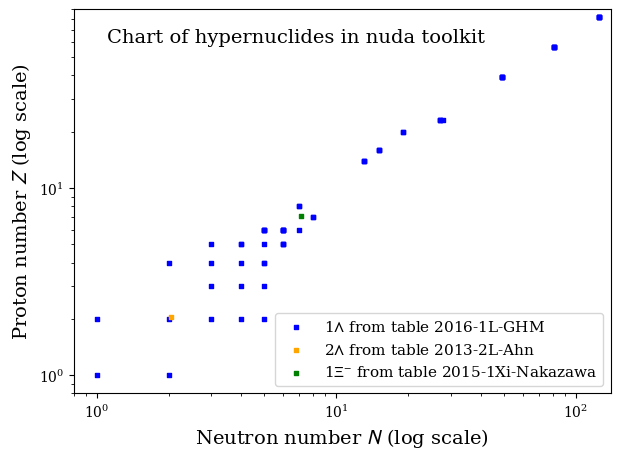
Plot the hyper-nuclear chart:
nuda.fig.hnuc_setupChart_fig( pname=None, tables1L=table1L, tables2L=table2L, tables1Xi=table1Xi )
Plot name: None
Processing table: 2016-1L-GHM
label:  Emul NAGARA KEK-E373 2013
probe: Emul NAGARA KEK-E373 2013